Tableau Visualizations
UPDATED: 2026-07-16 15:38:21
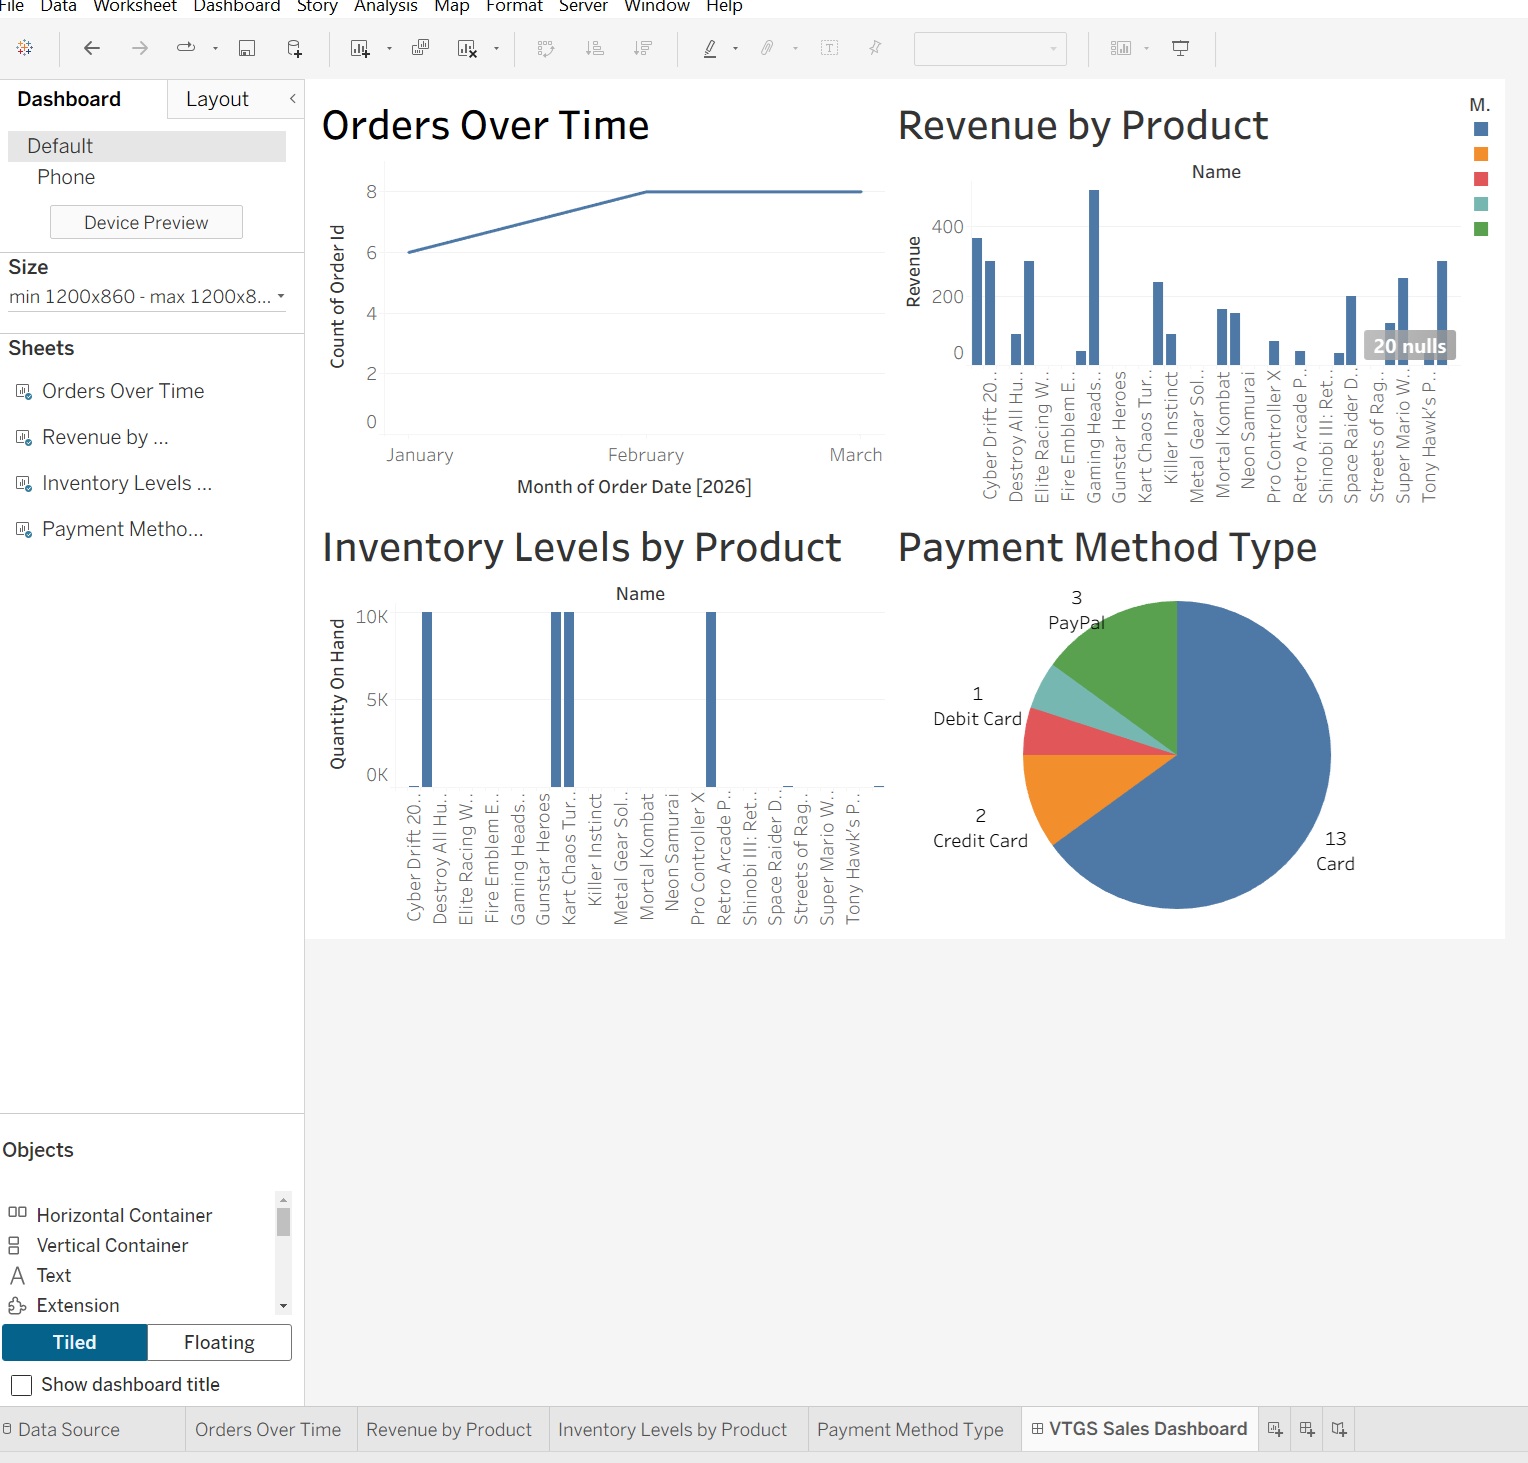
The following screenshots demonstrate Tableau dashboards and visualization analytics created using the Virtual Tech Gaming Store database.
These Tableau dashboards were created using exported database data and visualized
using Tableau to identify trends, sales performance, and platform popularity.
Tables Export
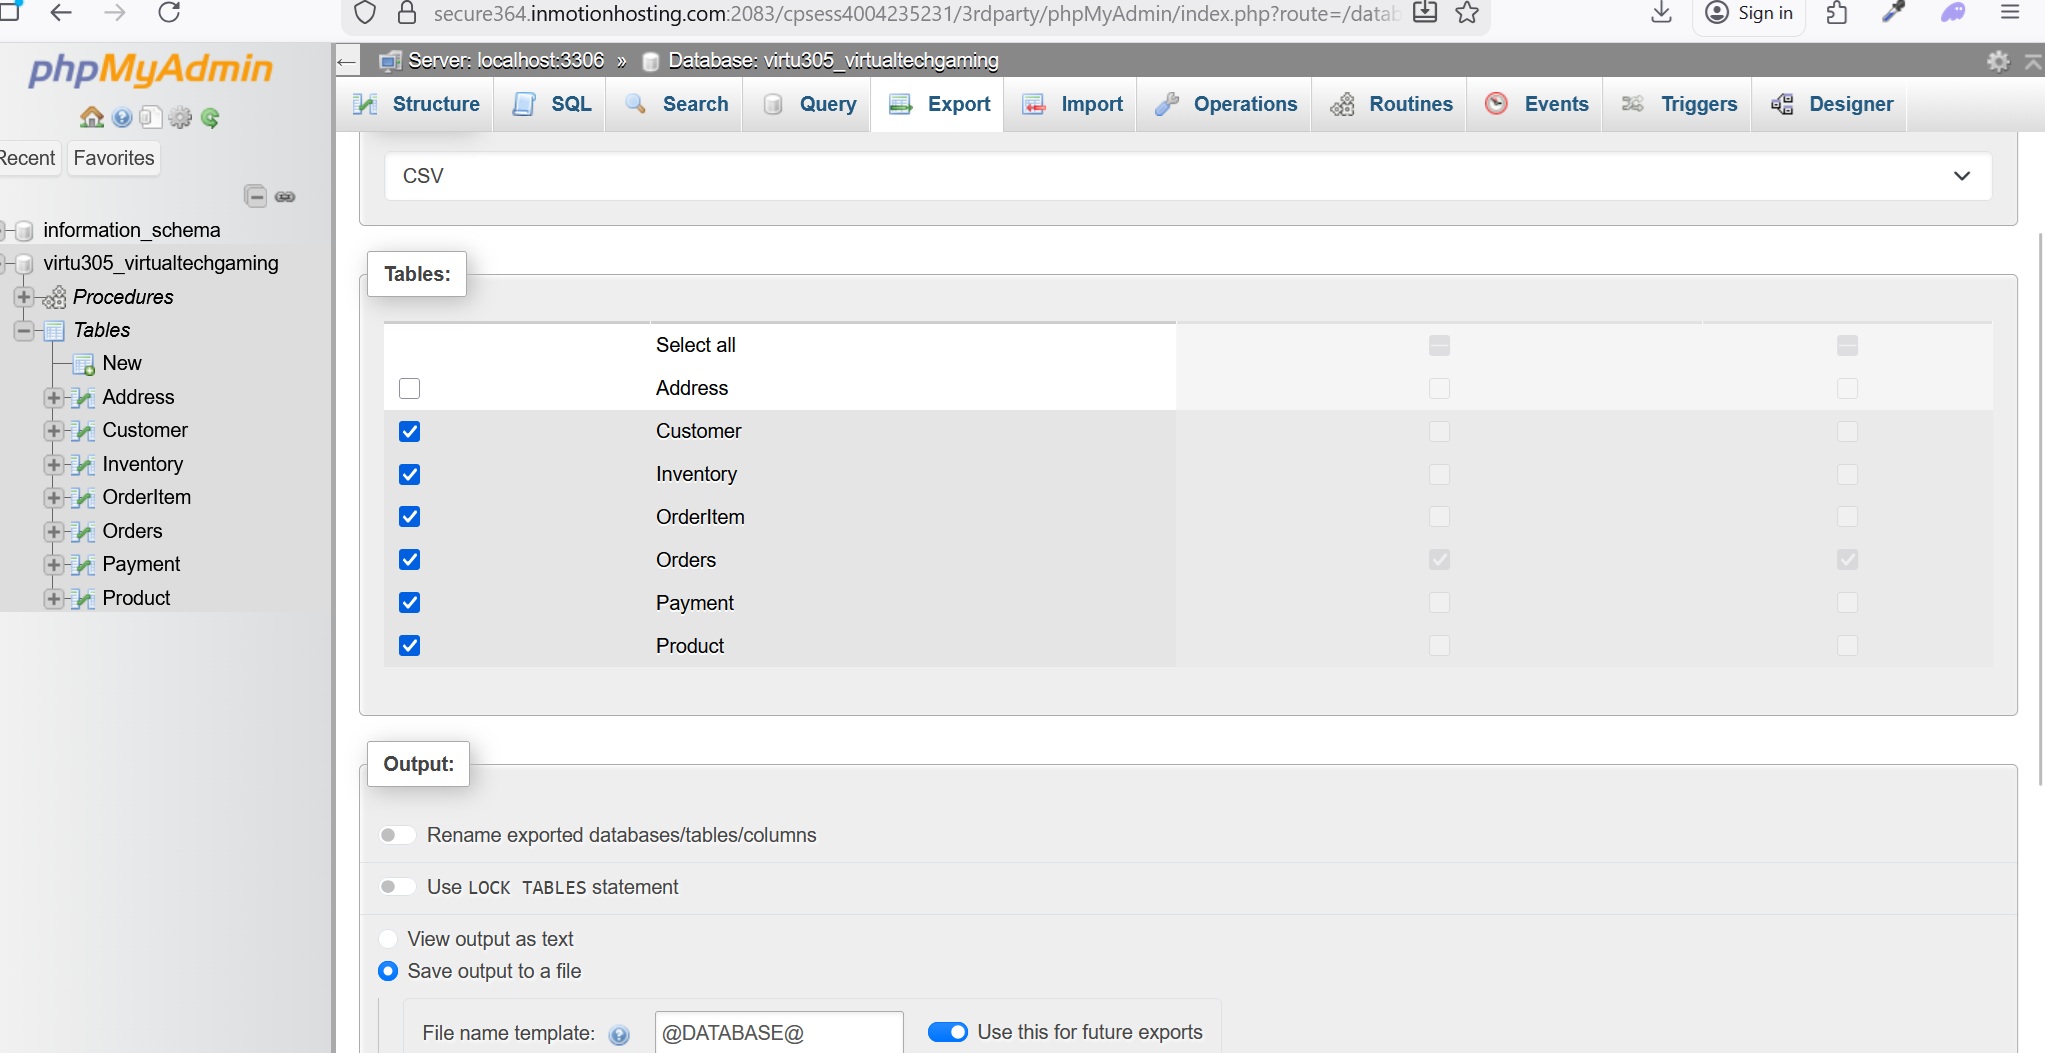
Tableau Connection Files
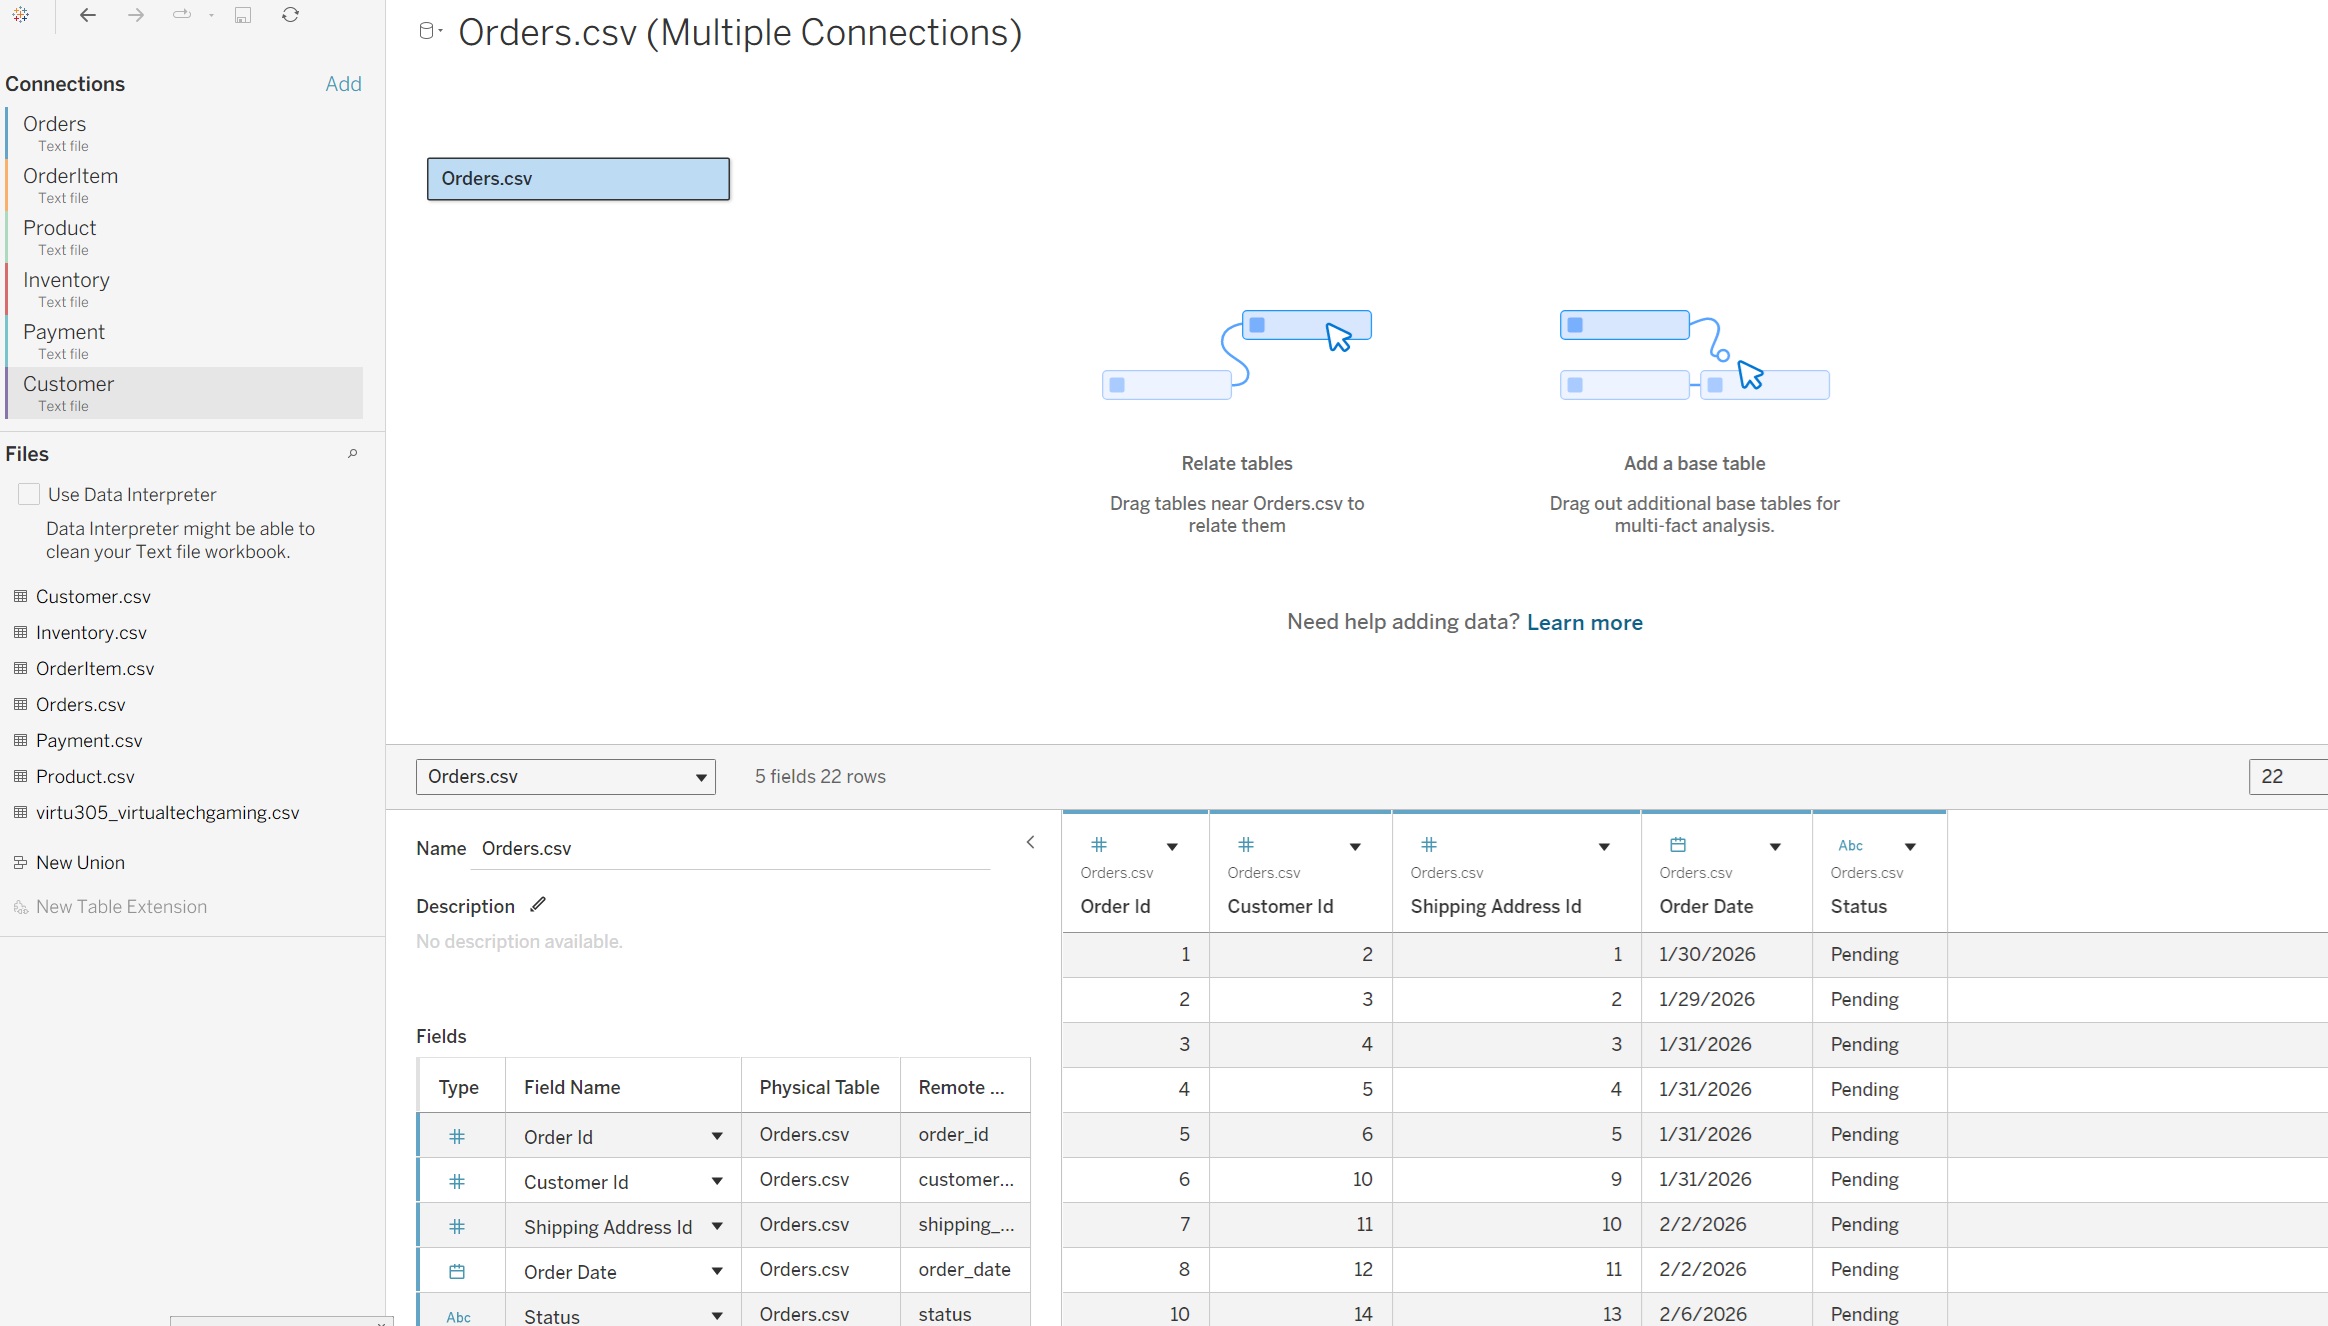
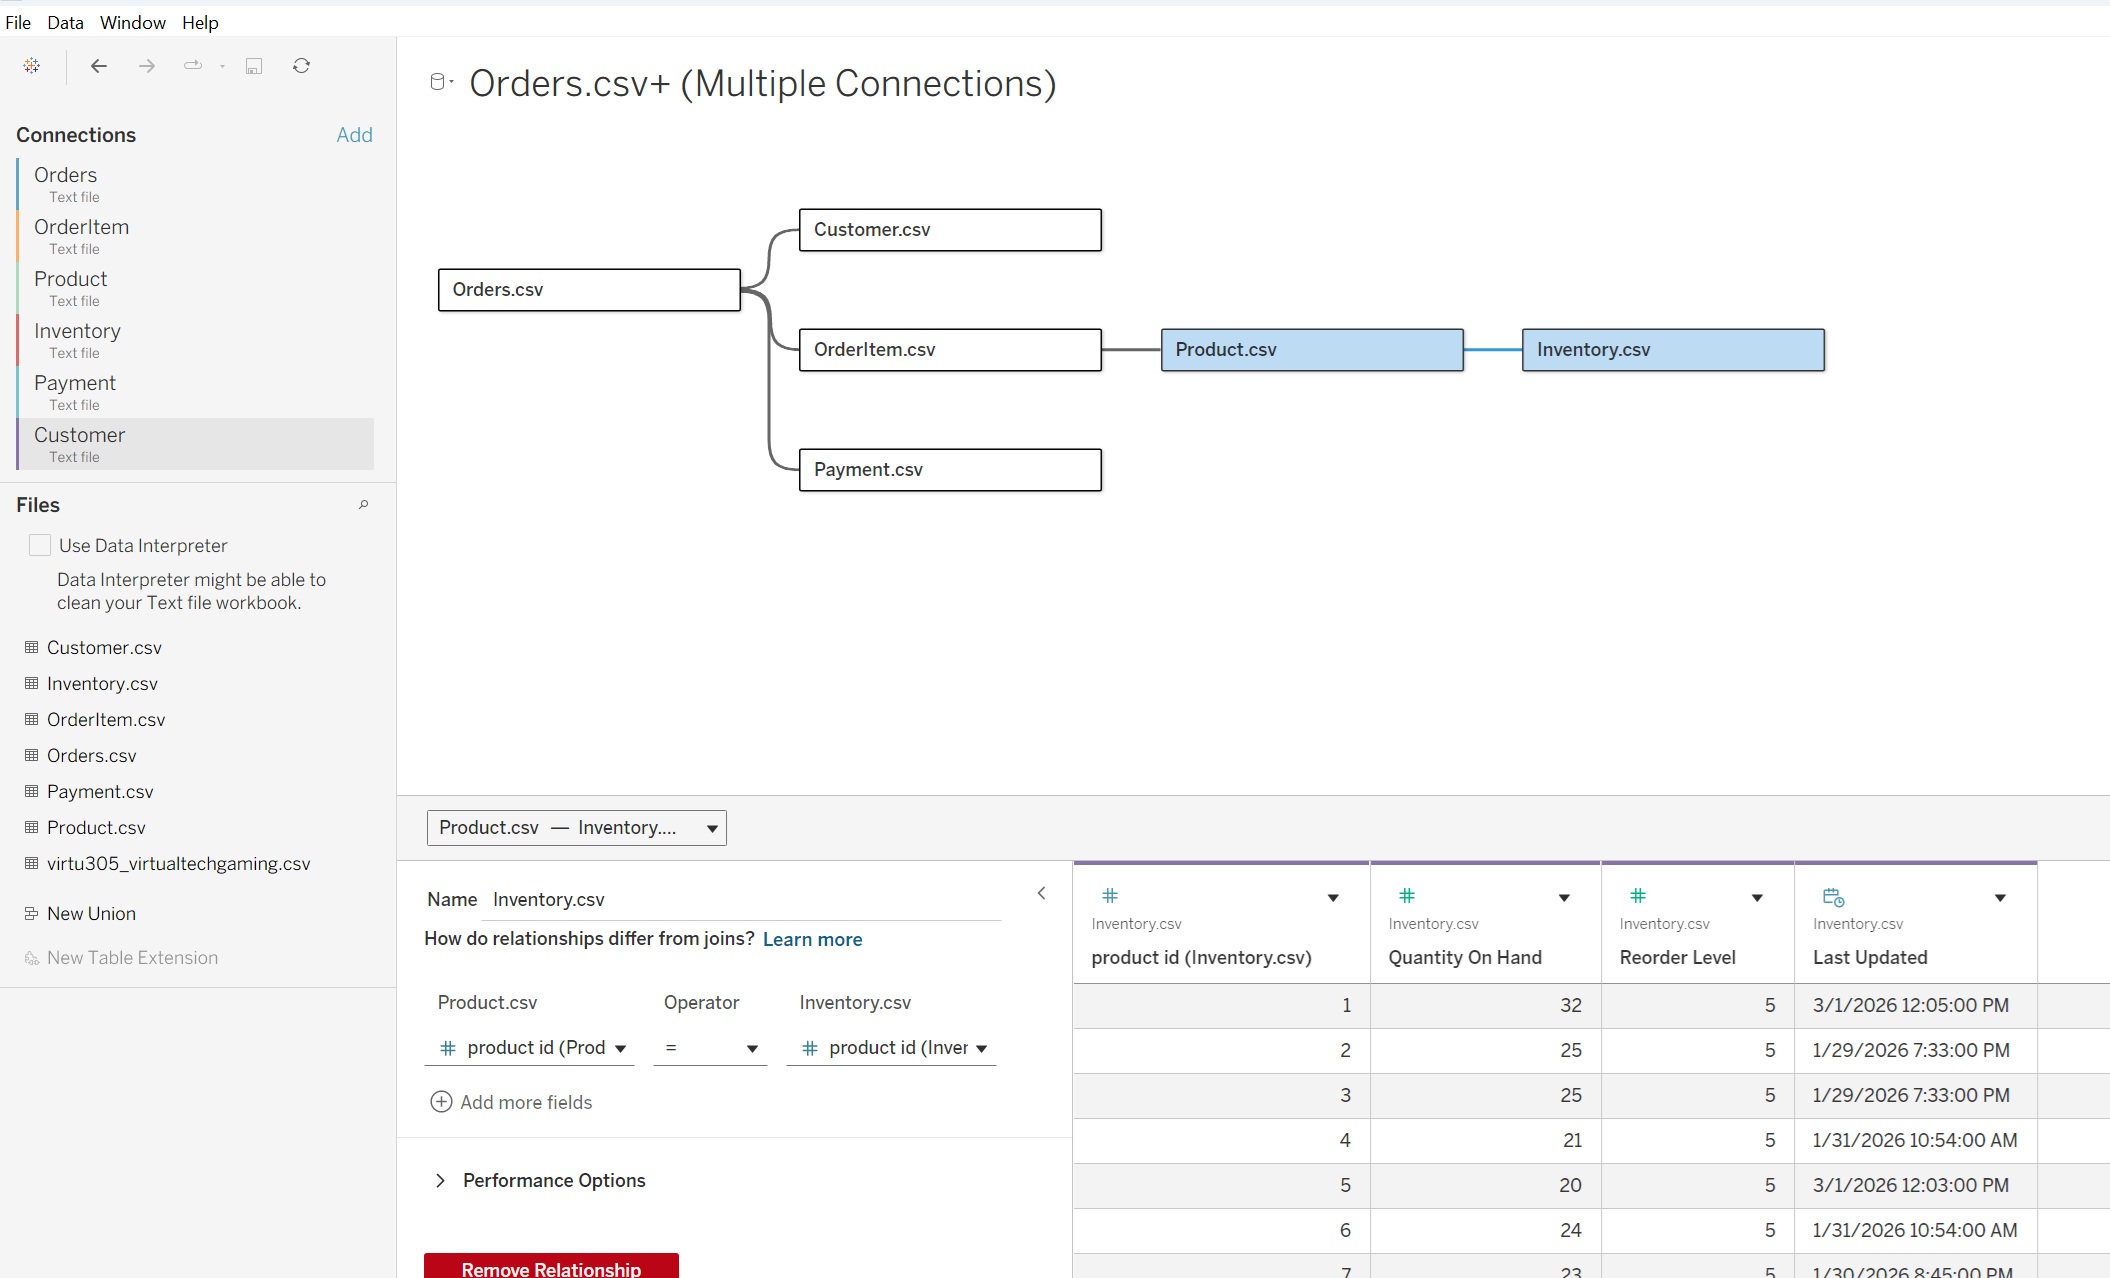
Tableau Relationships
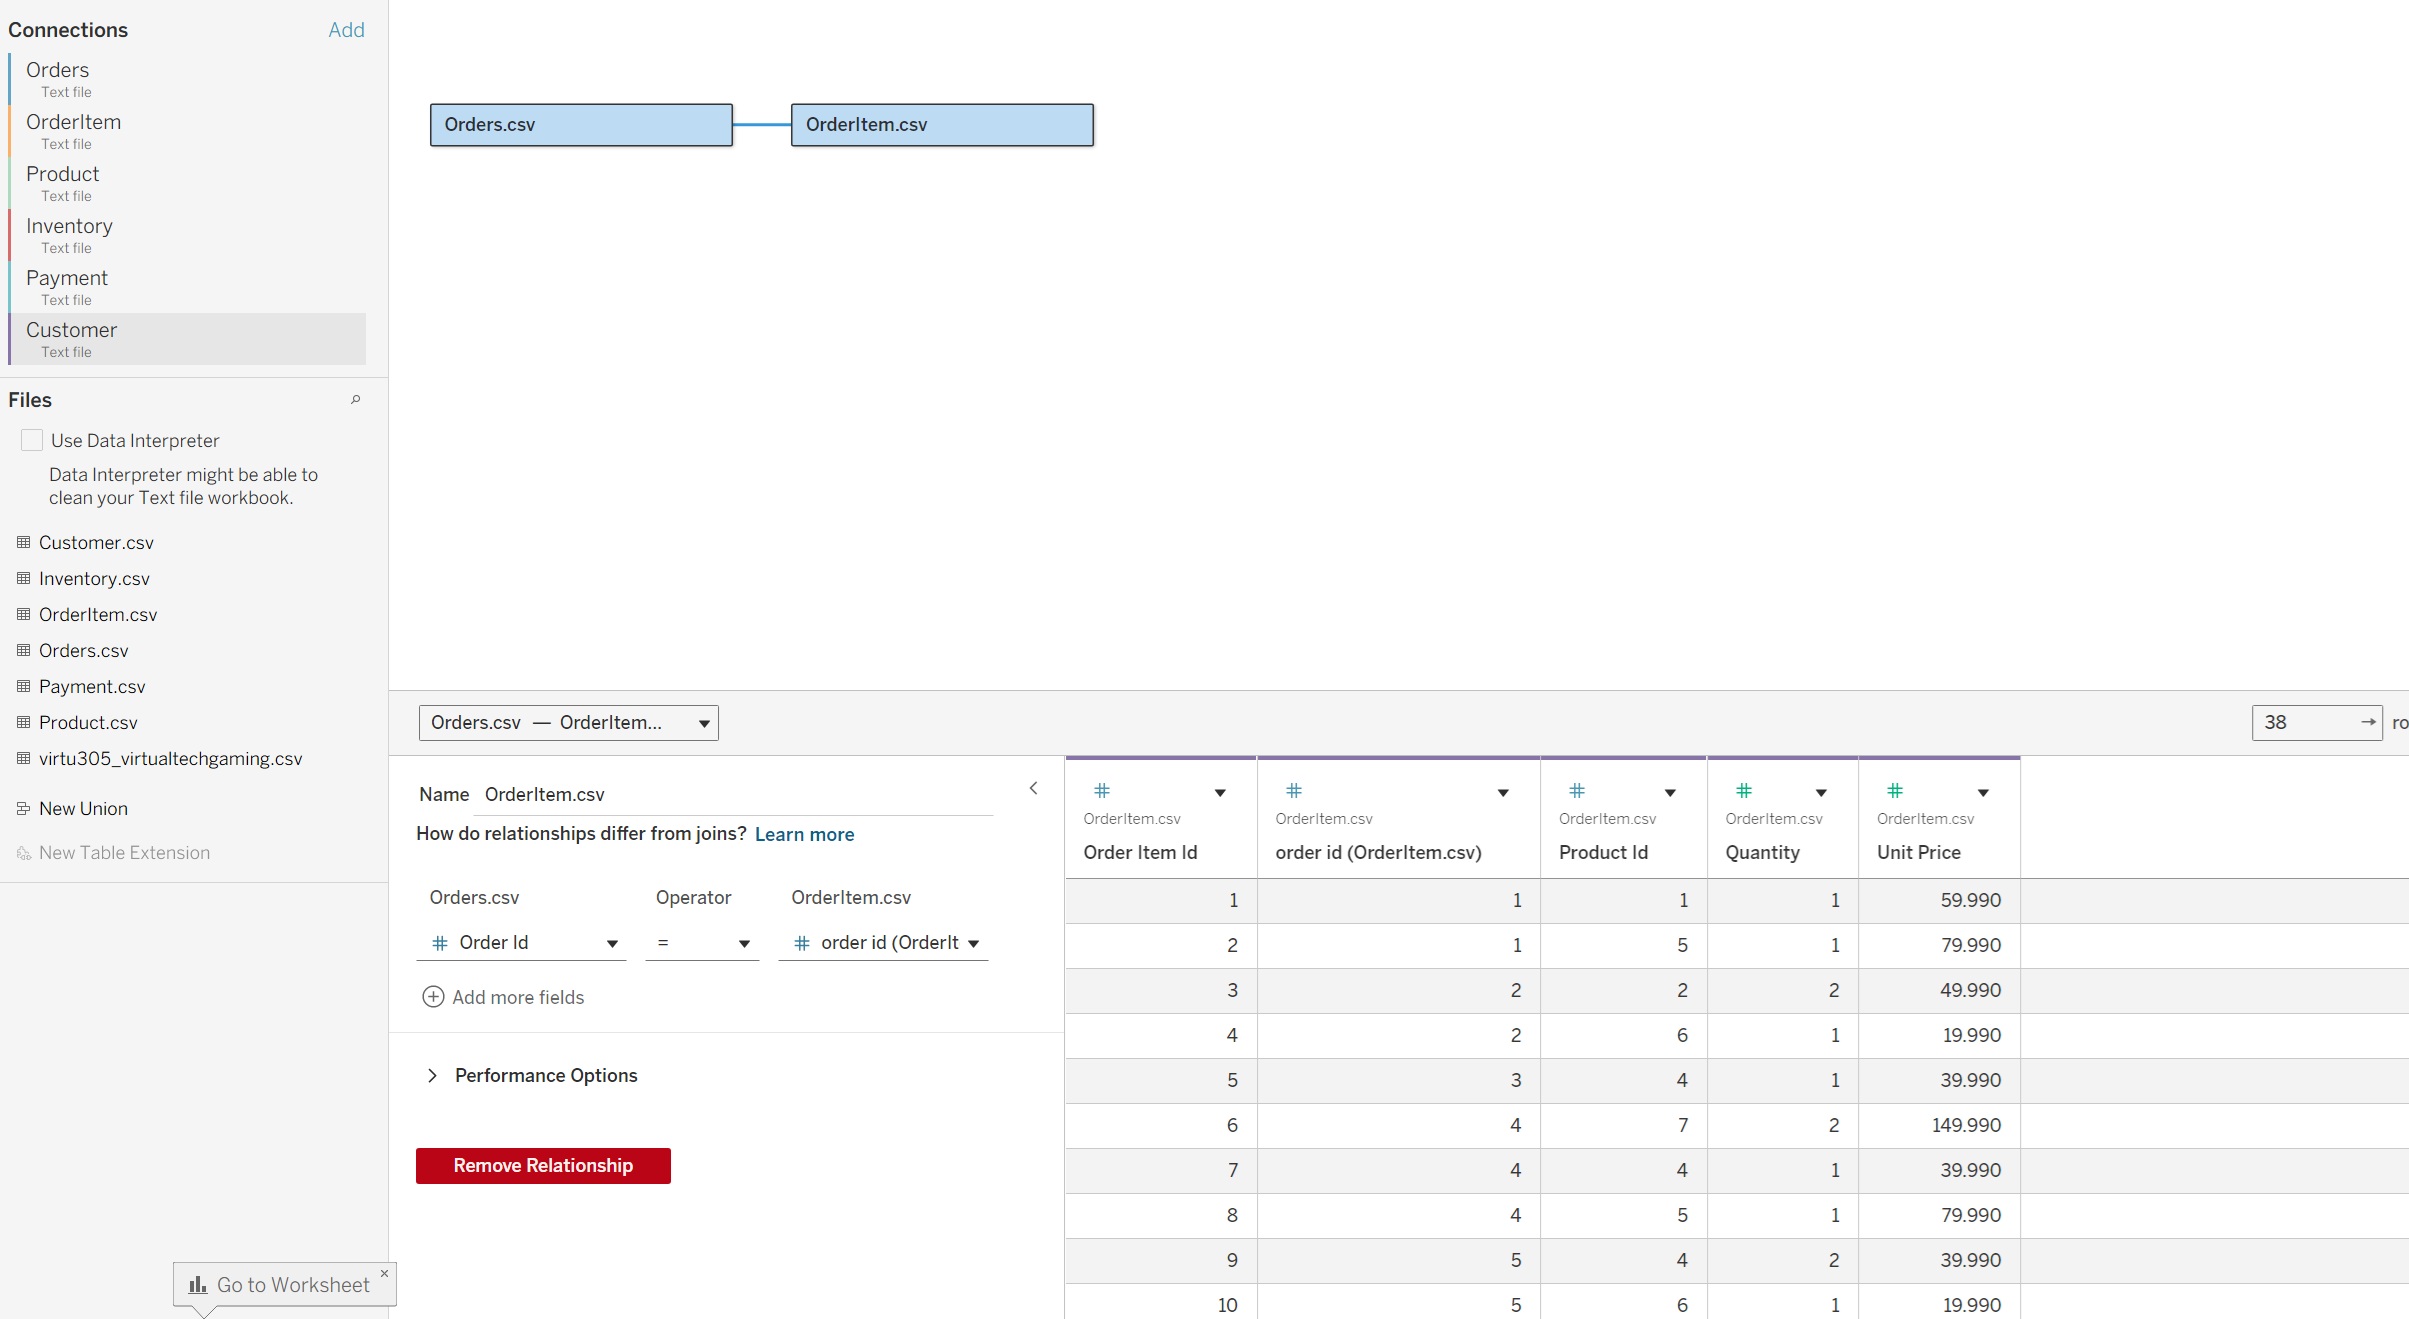
Data Model Complete
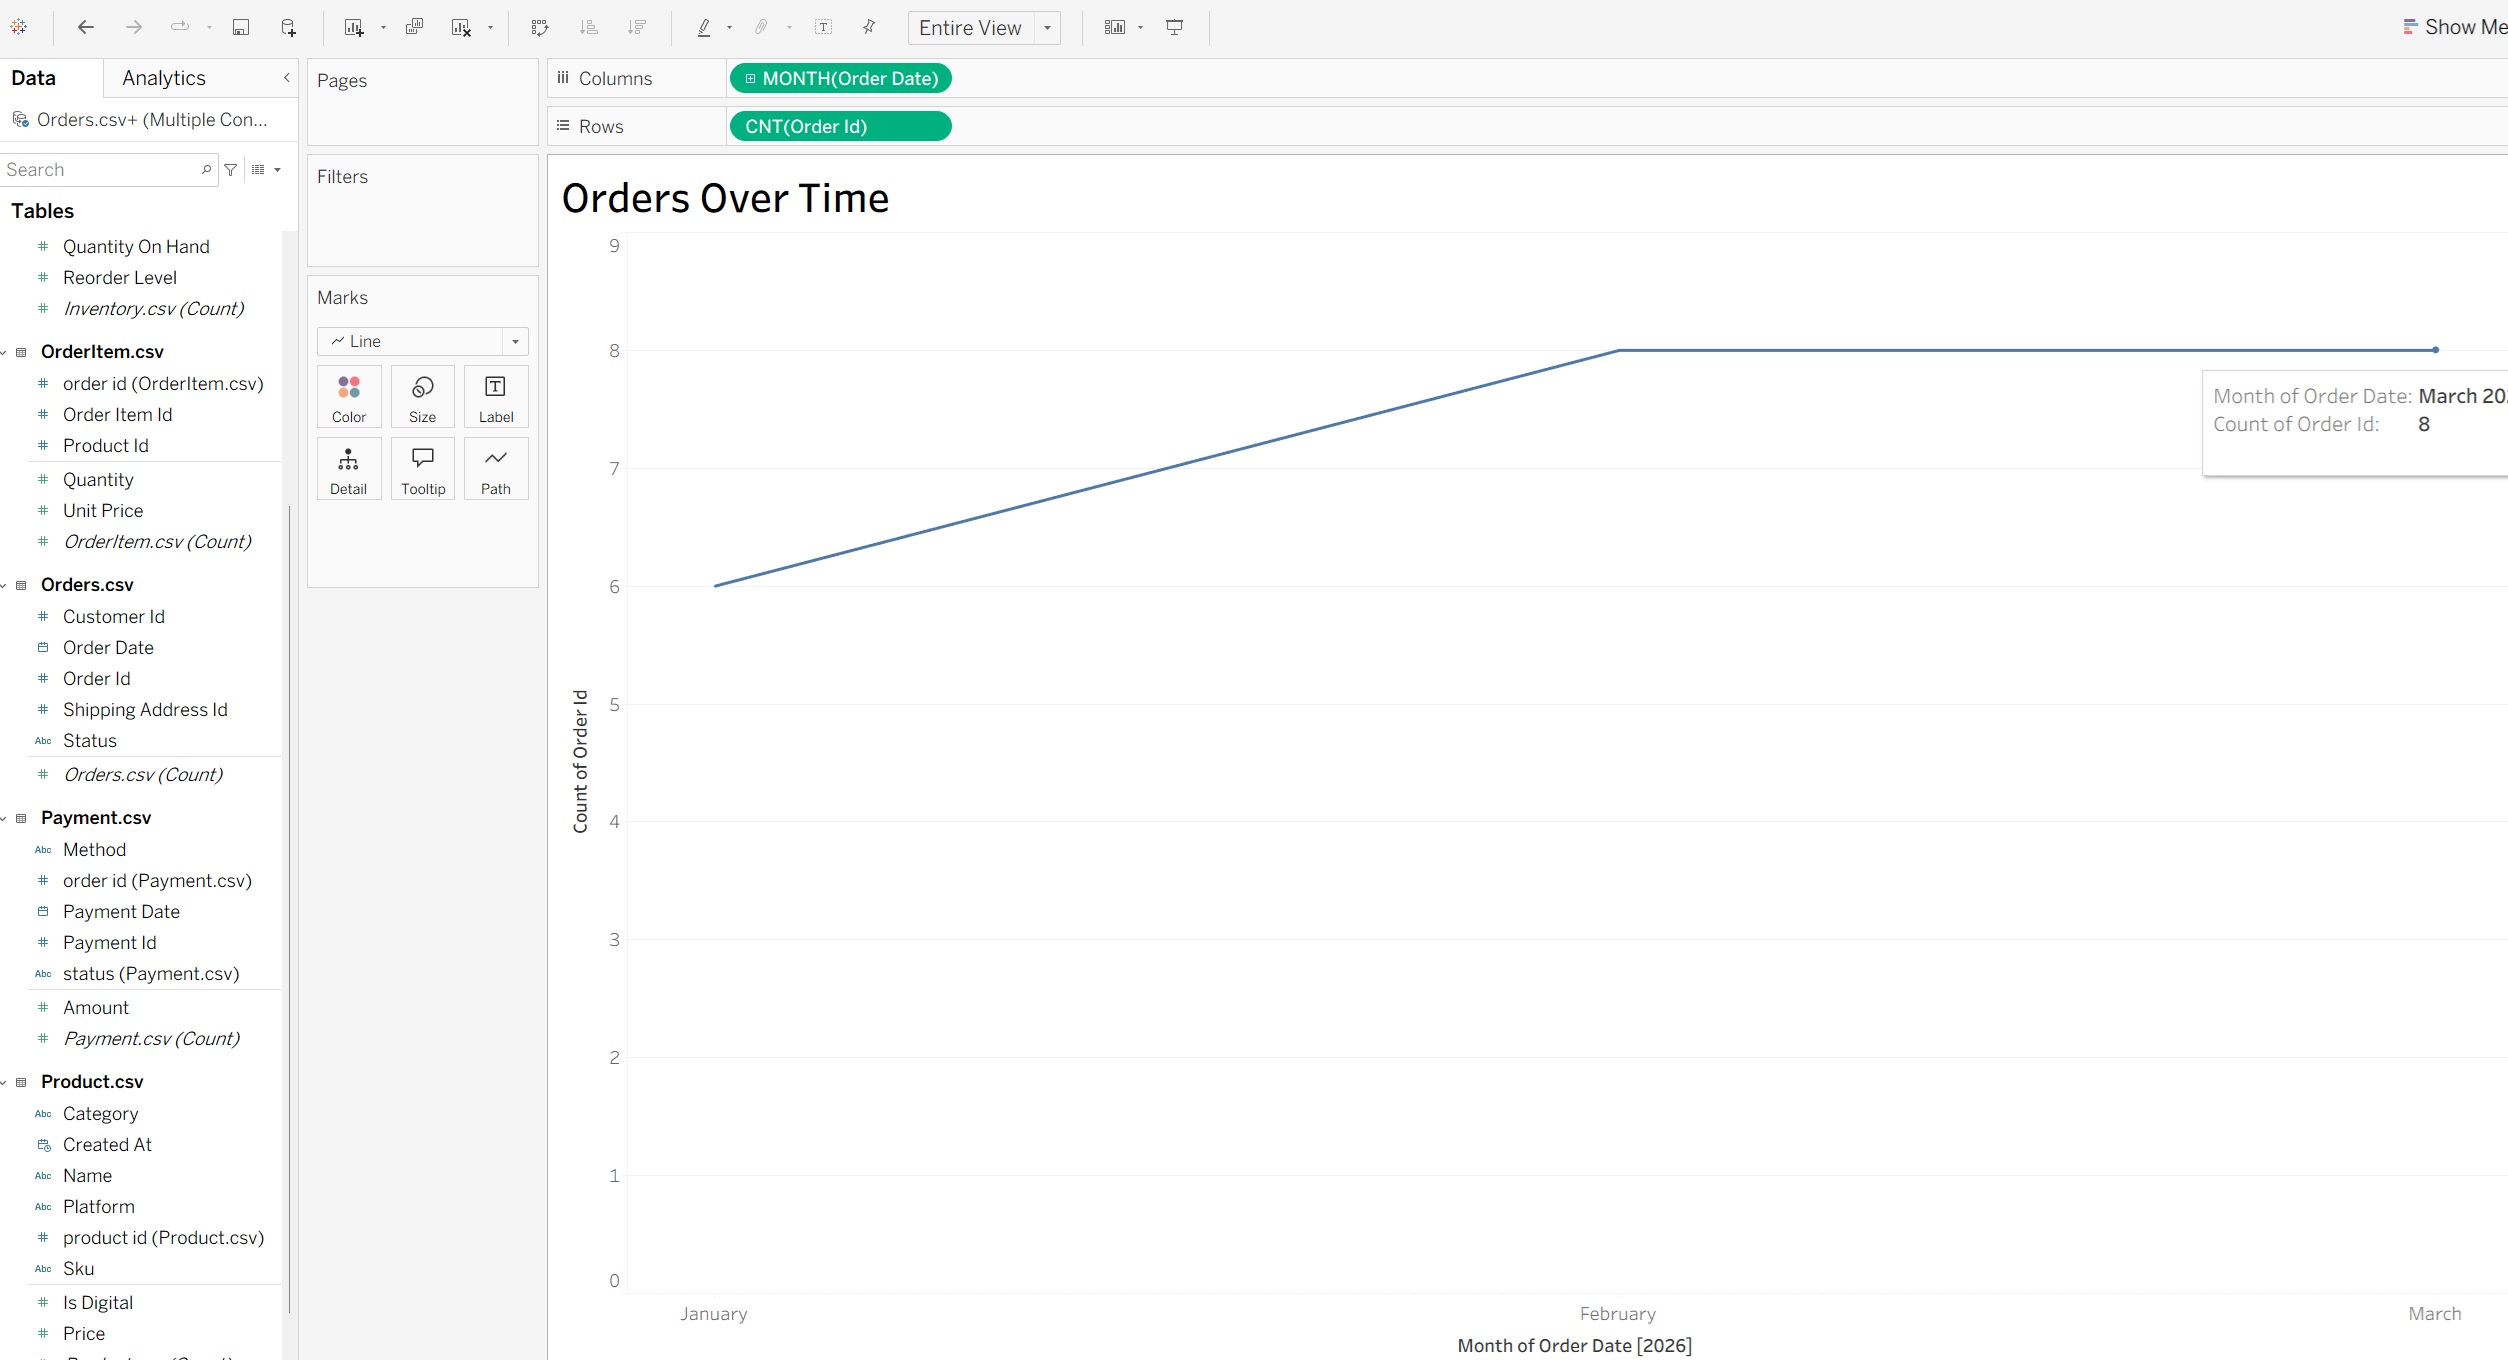
Orders Over Time Chart
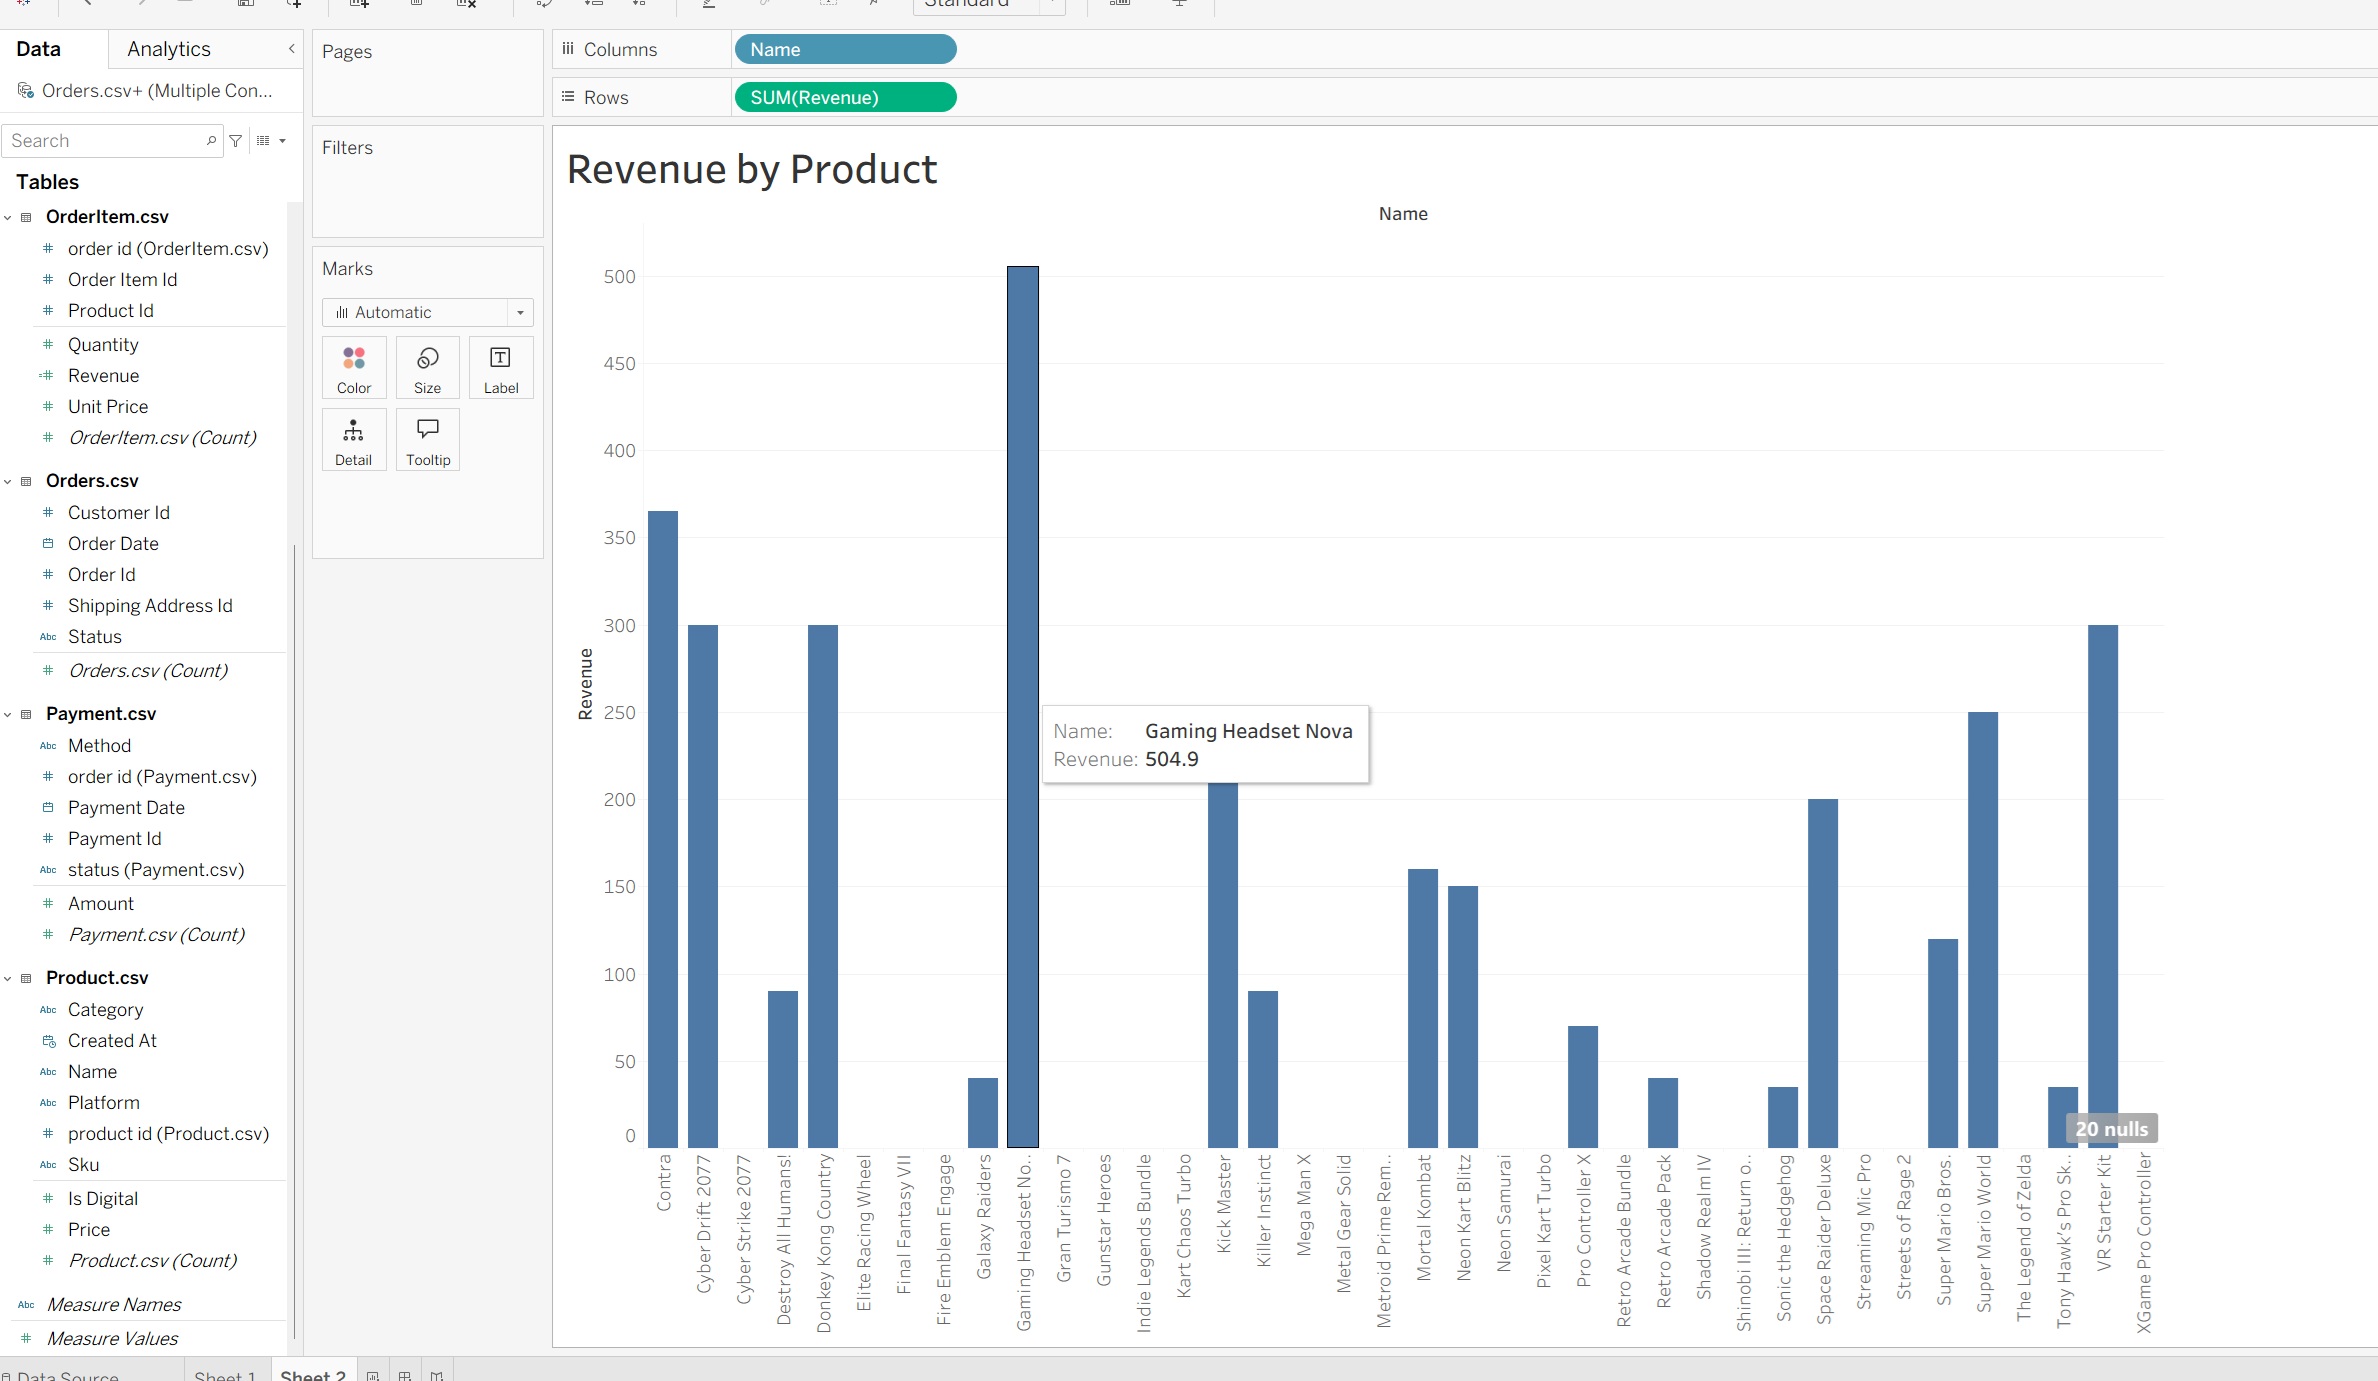
Revenue by Product
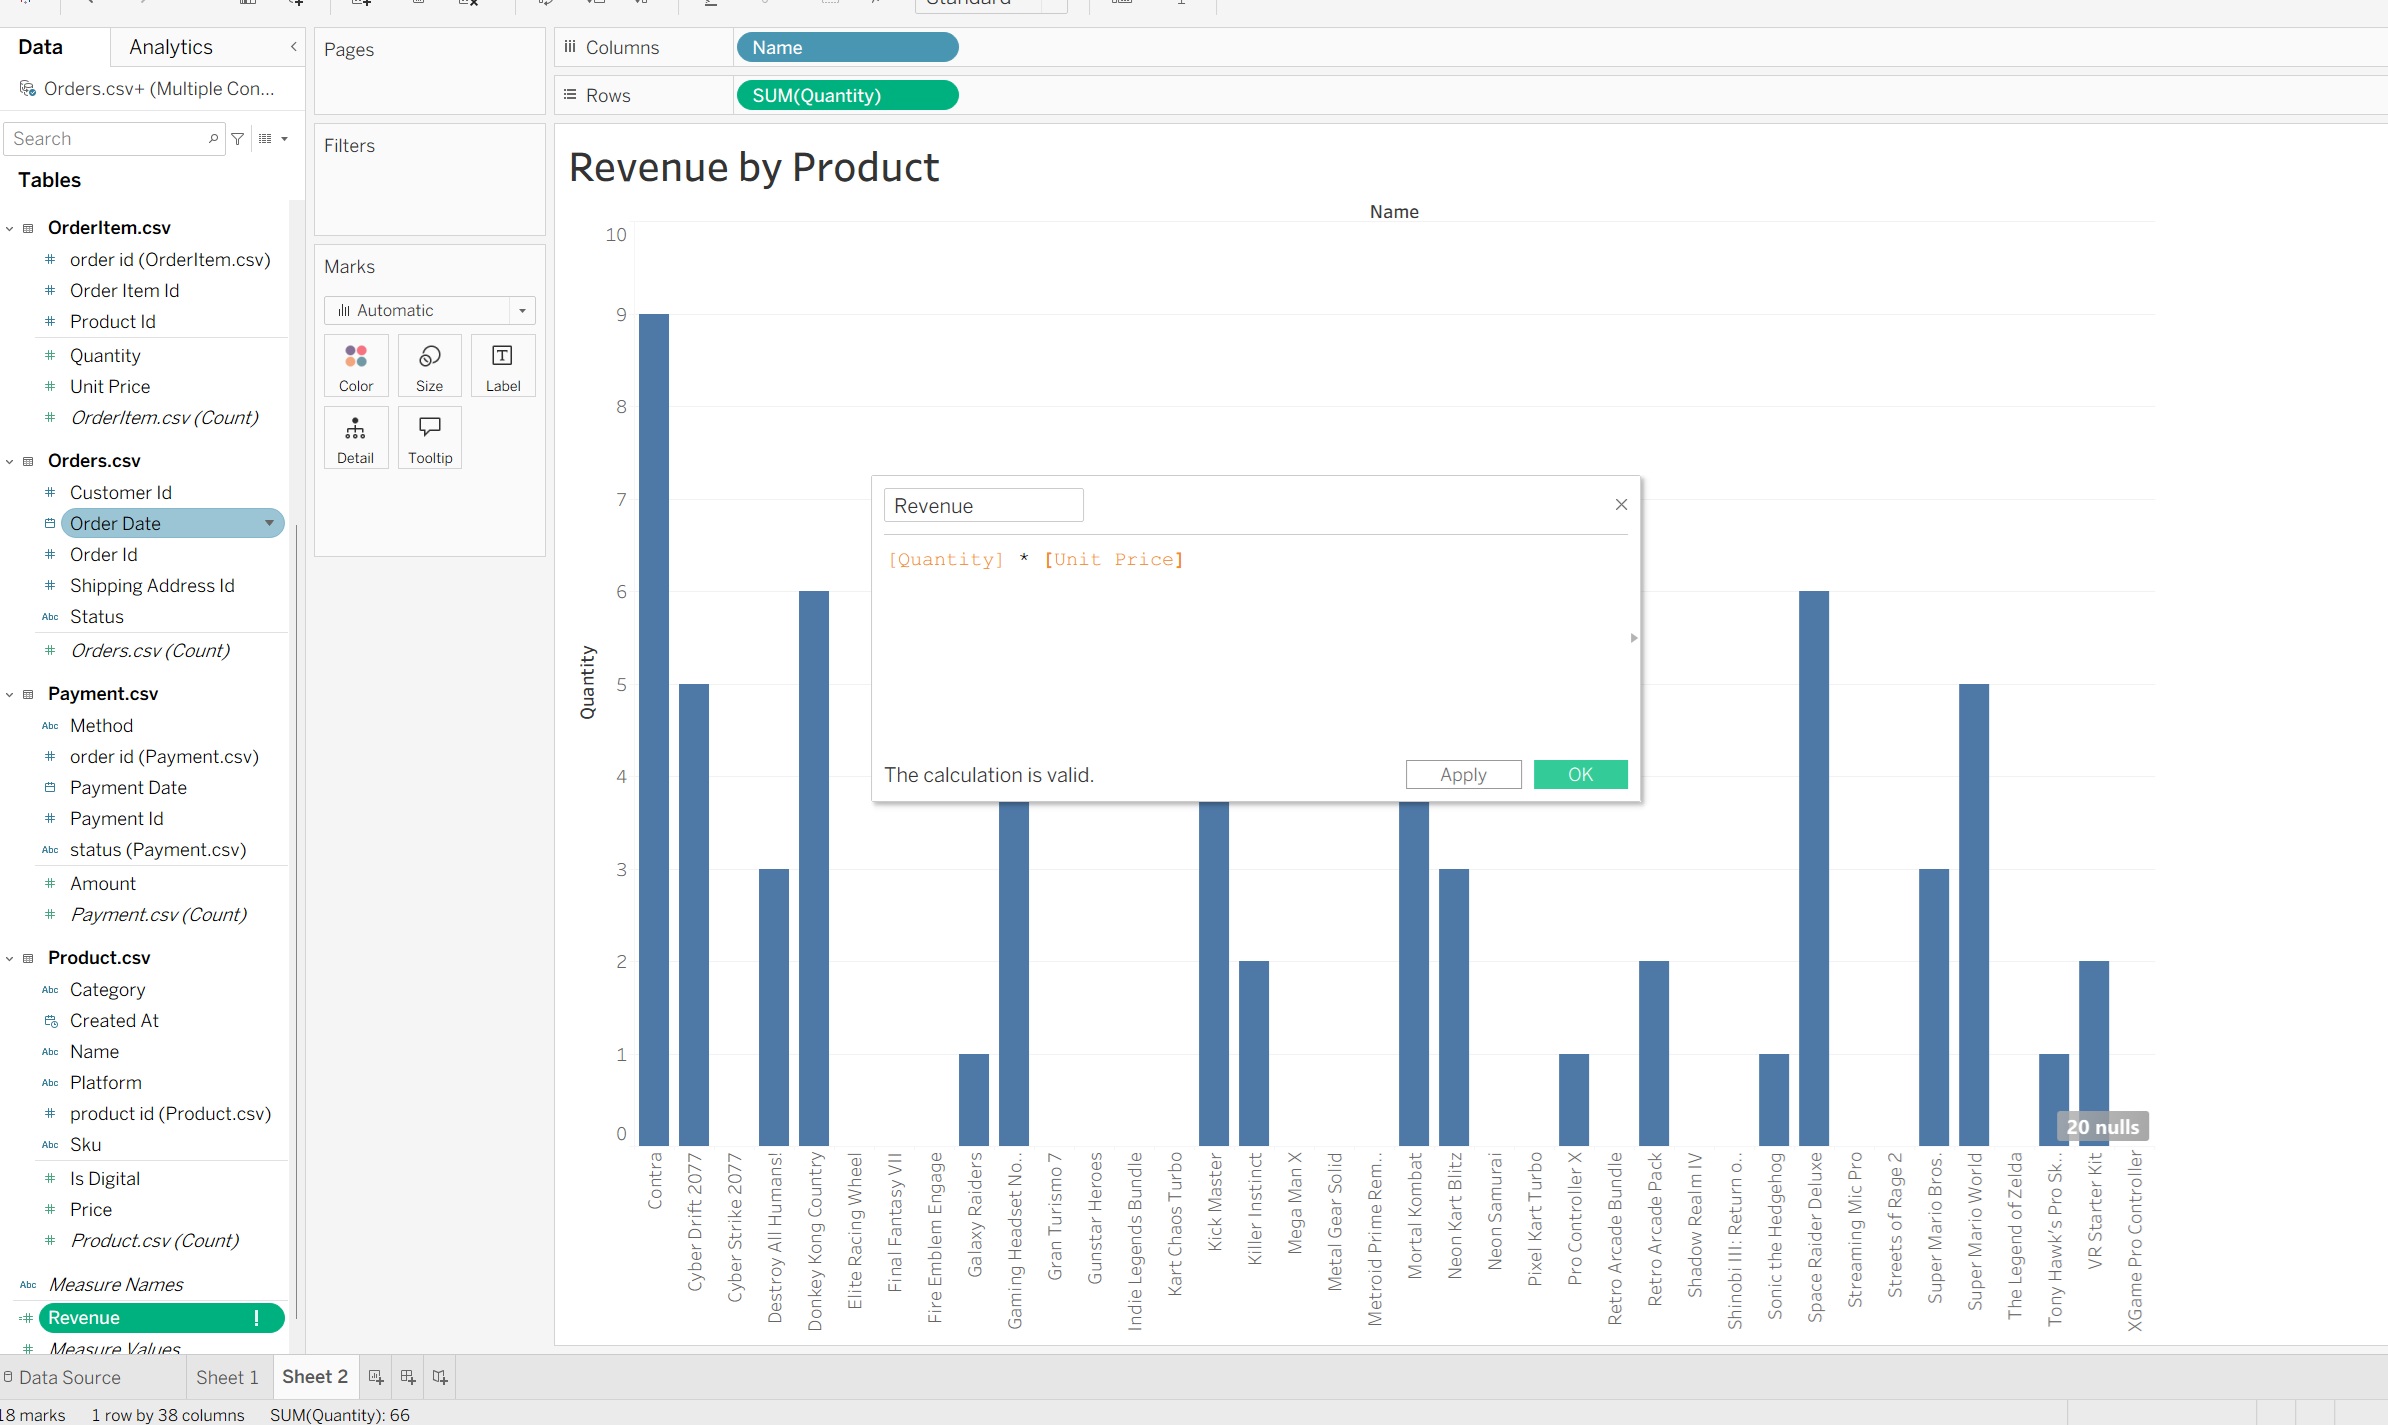
Revenue Formula Bar Chart
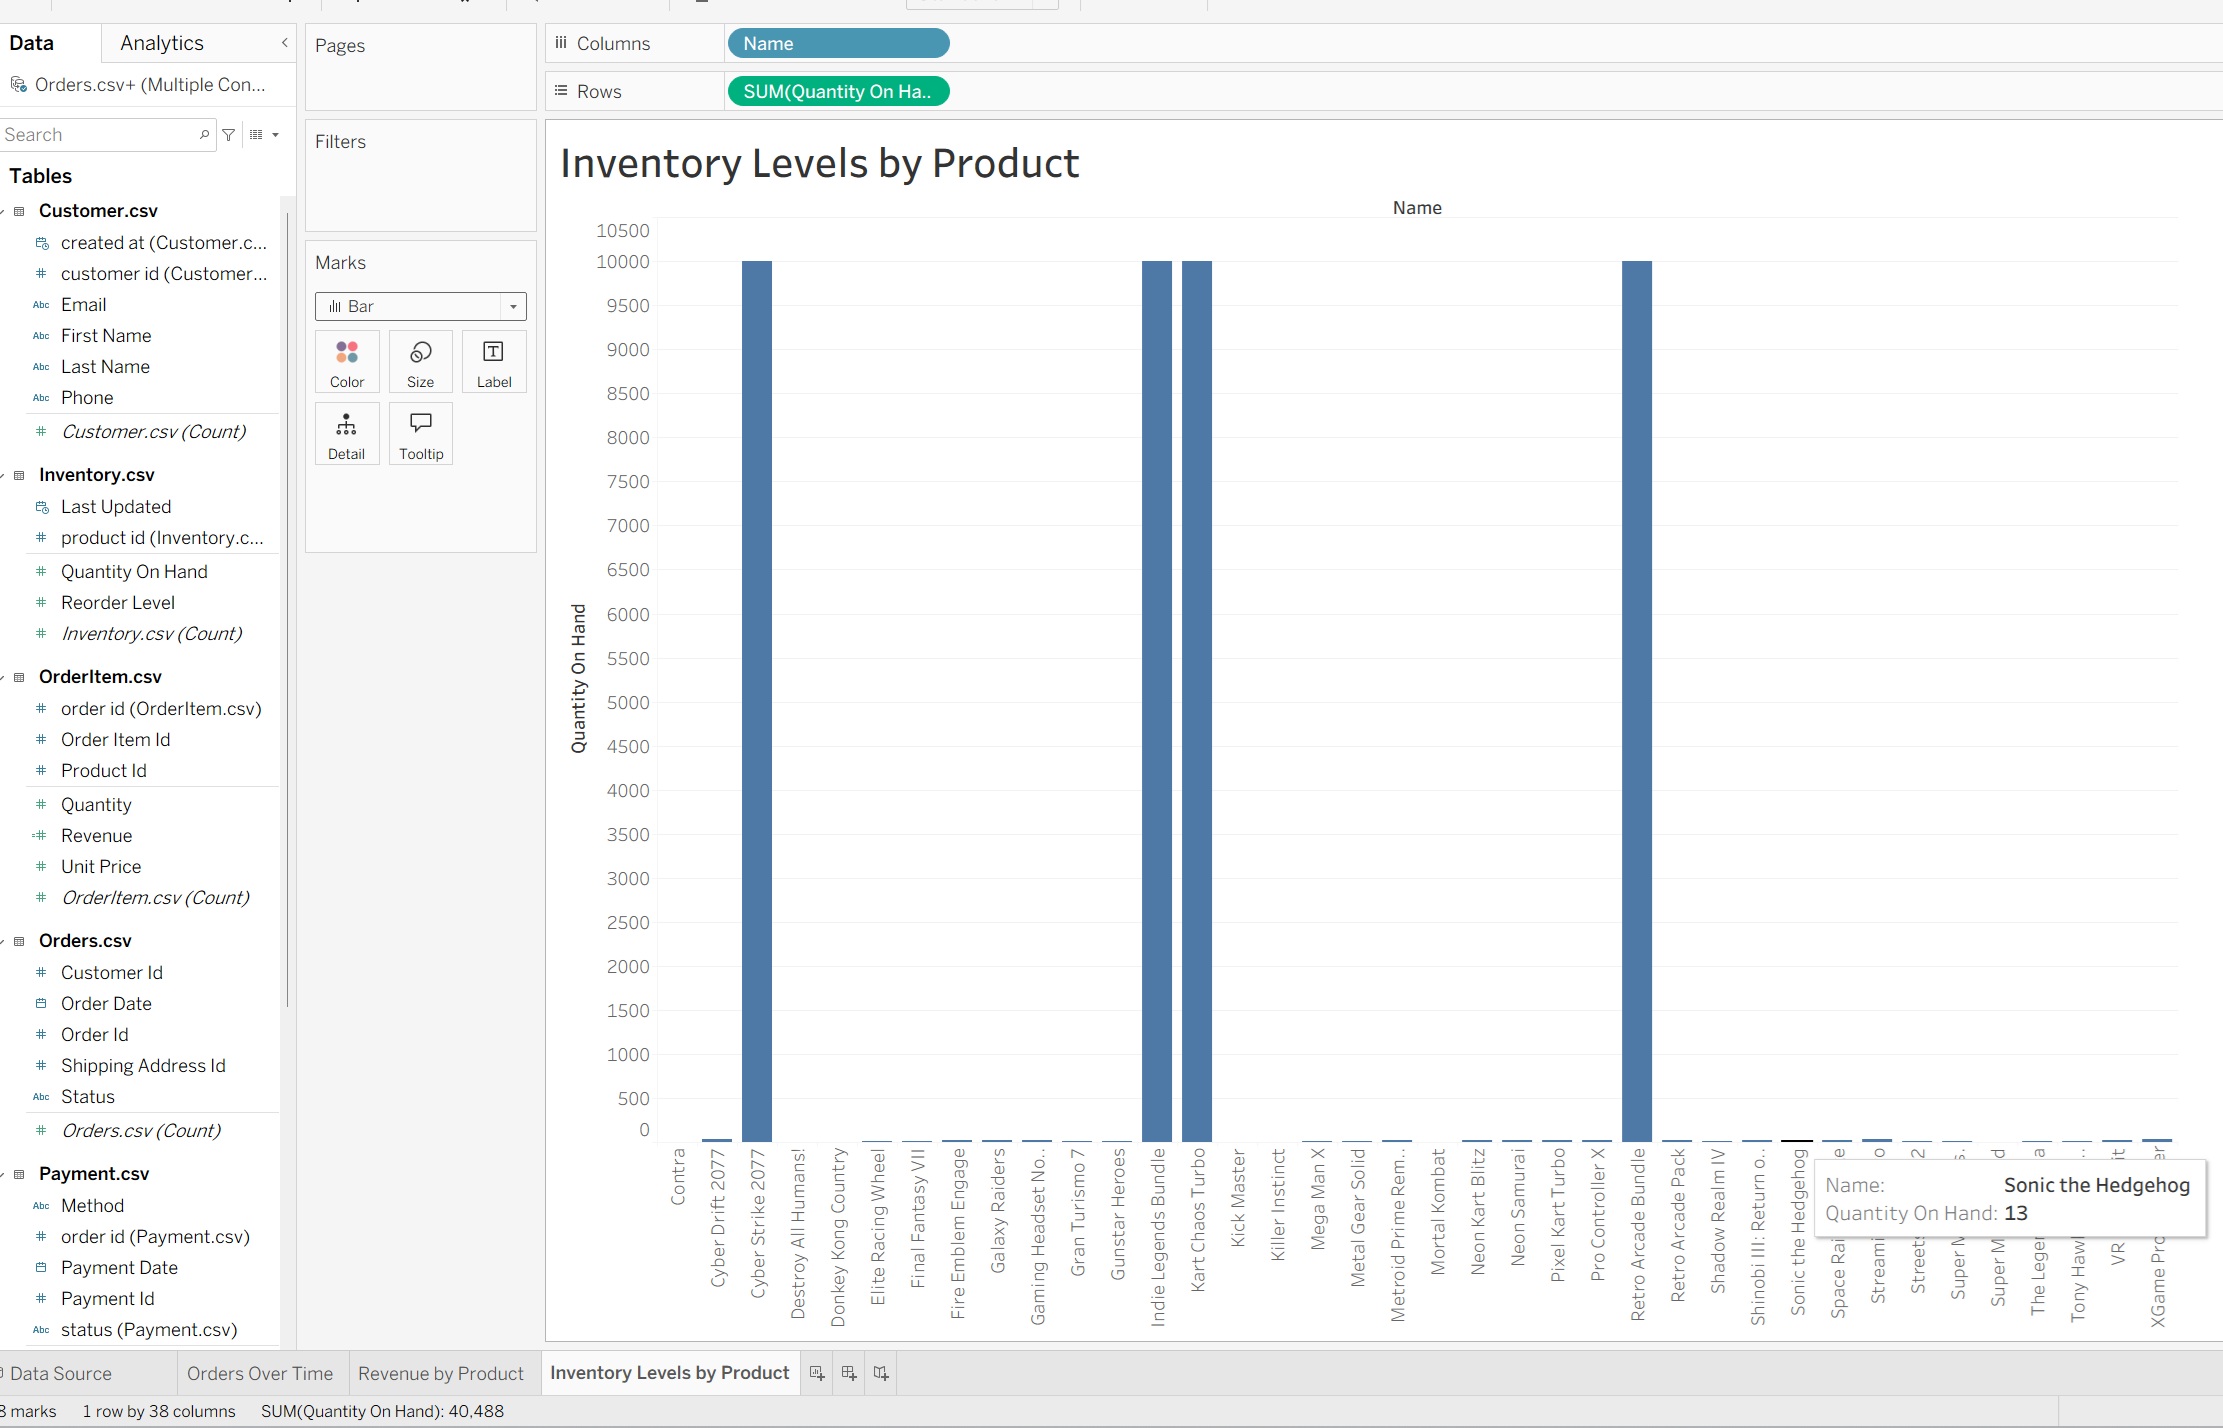
Inventory Levels by Product
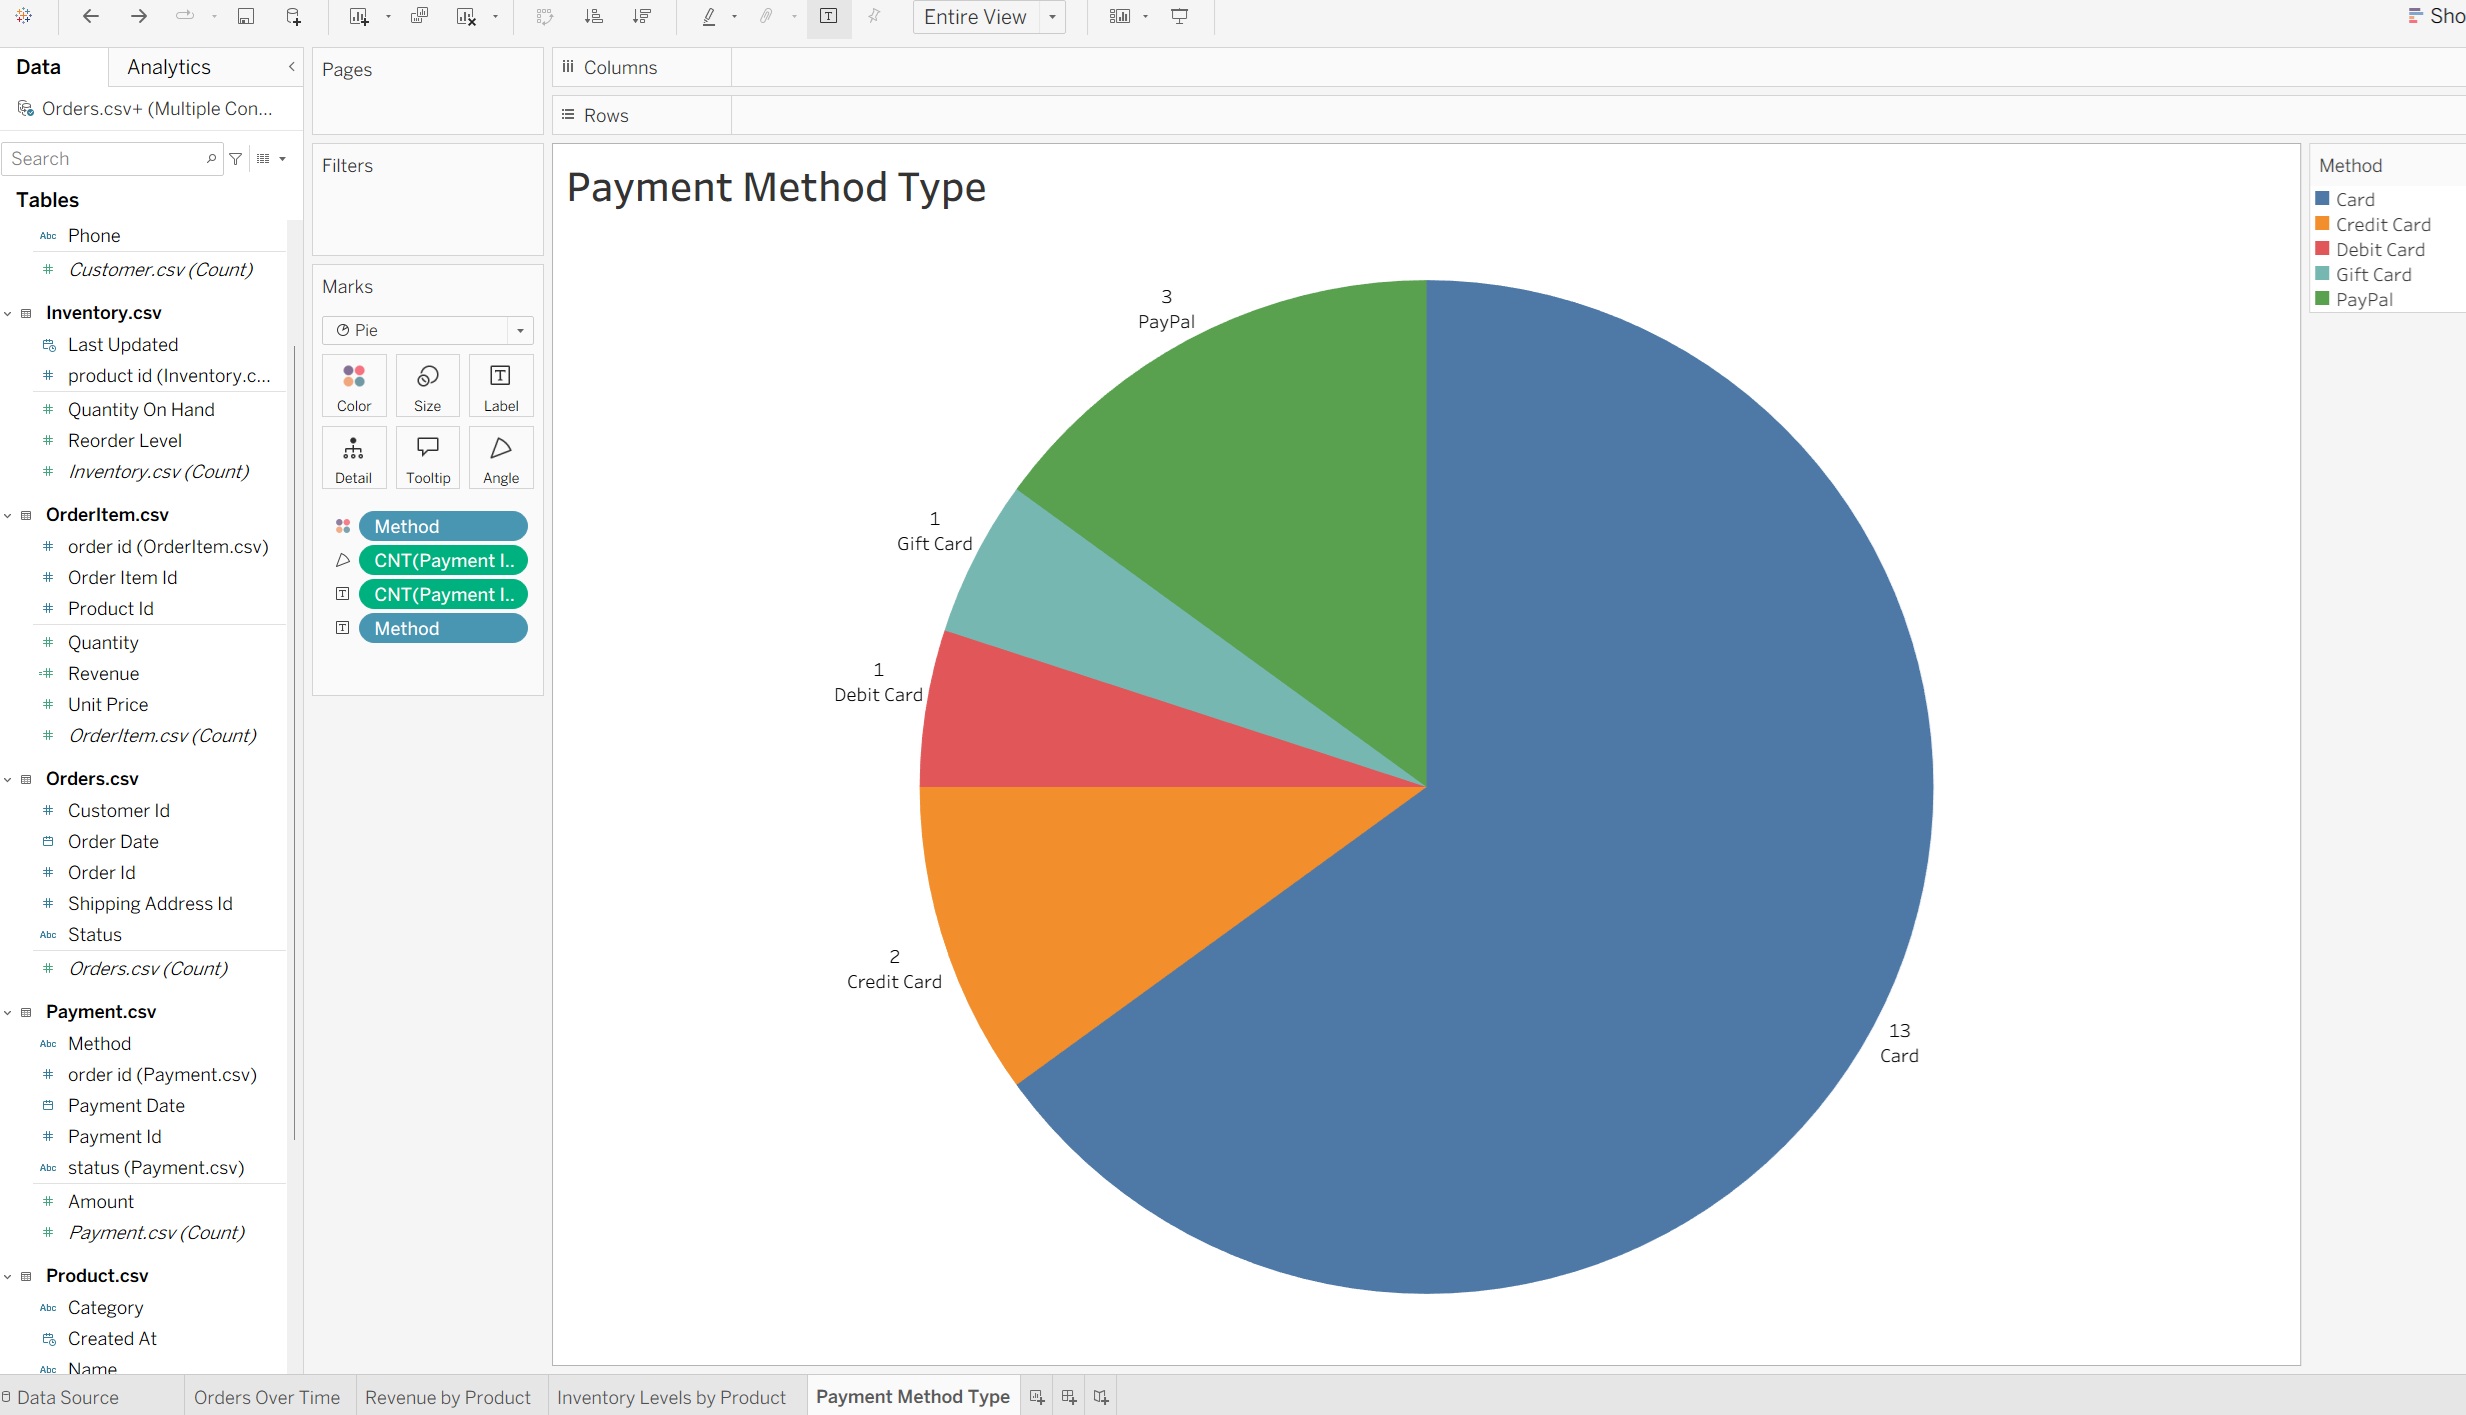
Payment Method Type
VTGS Dashboard